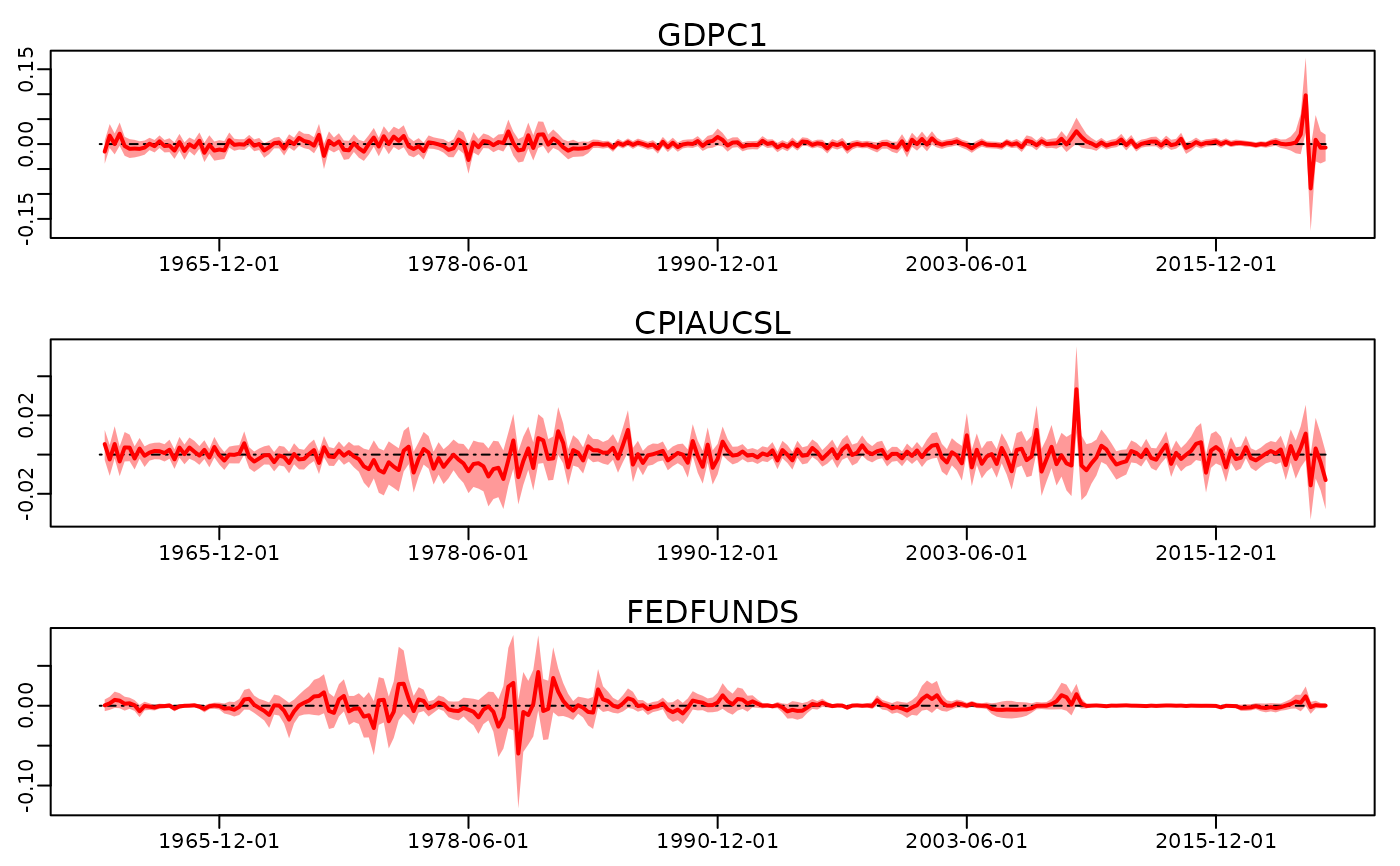
Visualization of the residuals of an estimated VAR.
Source:R/plots.R
plot.bayesianVARs_residuals.RdVisualization of the residuals of an estimated VAR.
Arguments
- x
A
bayesianVARs_residualsobject.- dates
optional vector of dates for labelling the x-axis. The default values is
NULL; in this case, the axis will be labeled with numbers.- vars
character vector containing the names of the variables to be visualized. The default is
"all"indicating that the fit of all variables is visualized.- quantiles
numeric vector indicating which quantiles to plot.
- n_col
integer indicating the number of columns to use for plotting.
- ...
Currently ignored.
See also
residuals method for class 'bayesianVARs_bvar':
residuals.bayesianVARs_bvar().Other plotting
plot.bayesianVARs_bvar(),plot.bayesianVARs_fitted(),plot.bayesianVARs_predict(),pairs.bayesianVARs_predict(),posterior_heatmap().